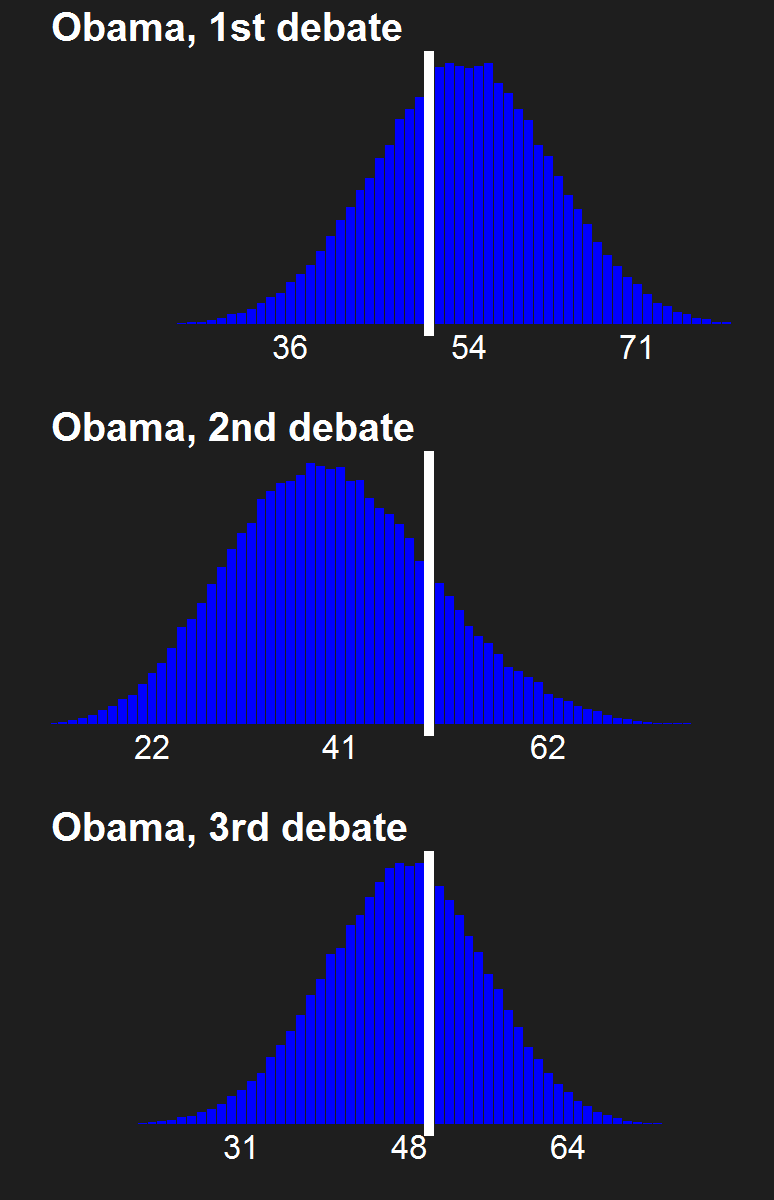
Tomorrow, I launch this puppy. One of the things you'll see on the sidebar (and in my analysis post) is an image I'm calling "fuzzy portraits". It let's you visually compare our uncertainty in the bullpucky each presidential candidate and their running mate spews.
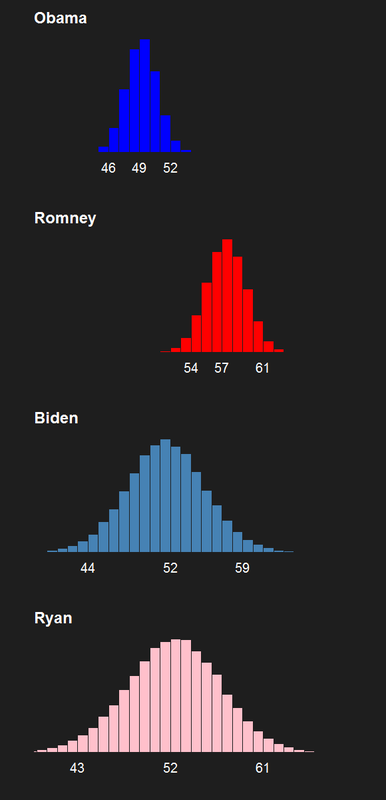
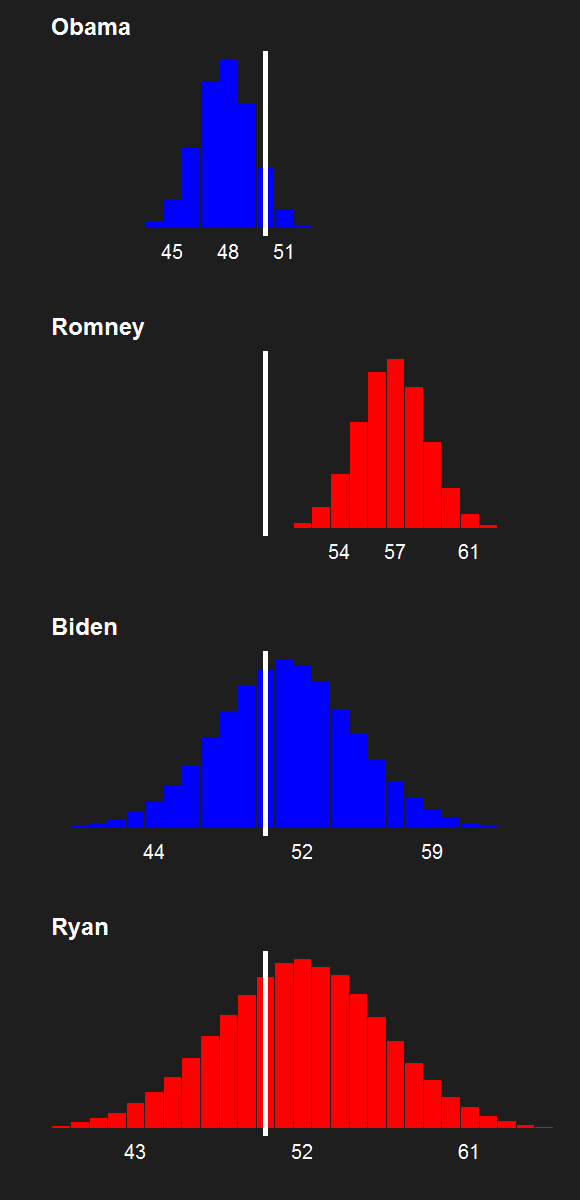
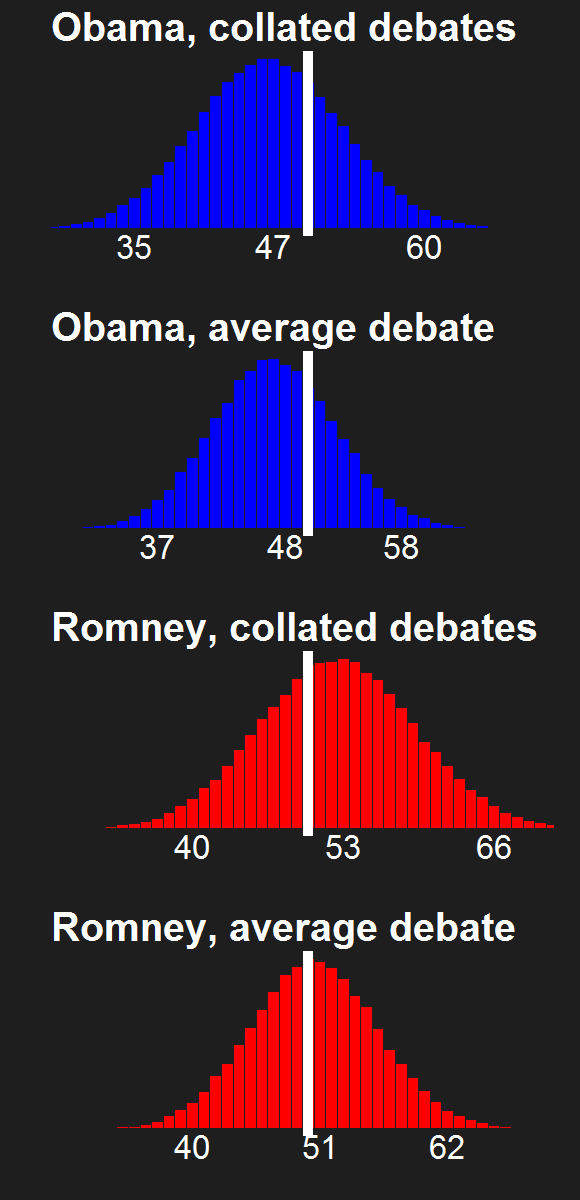
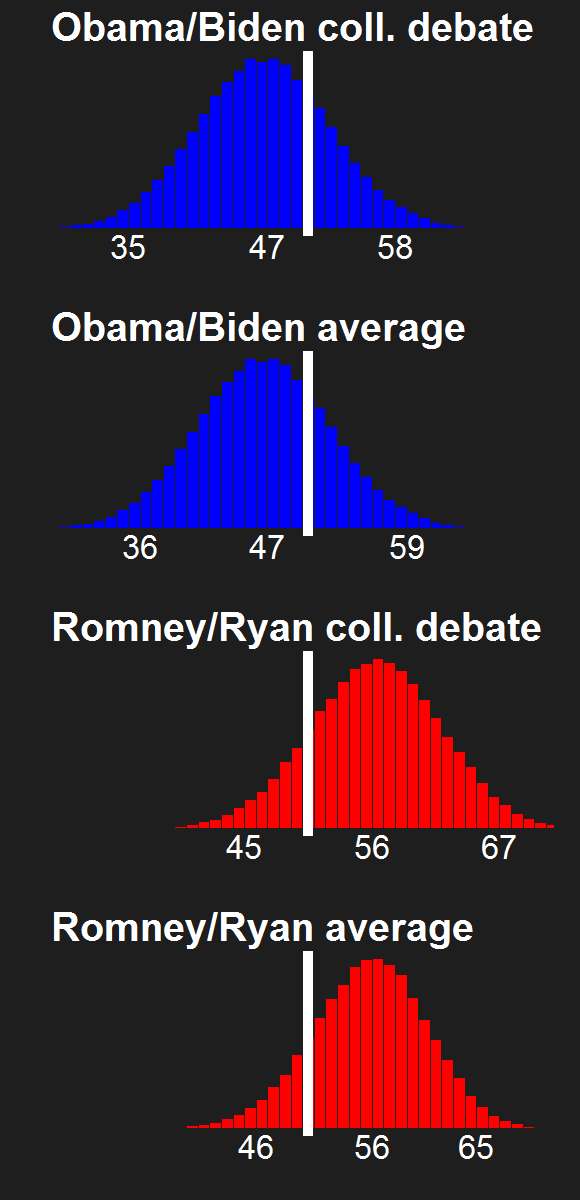
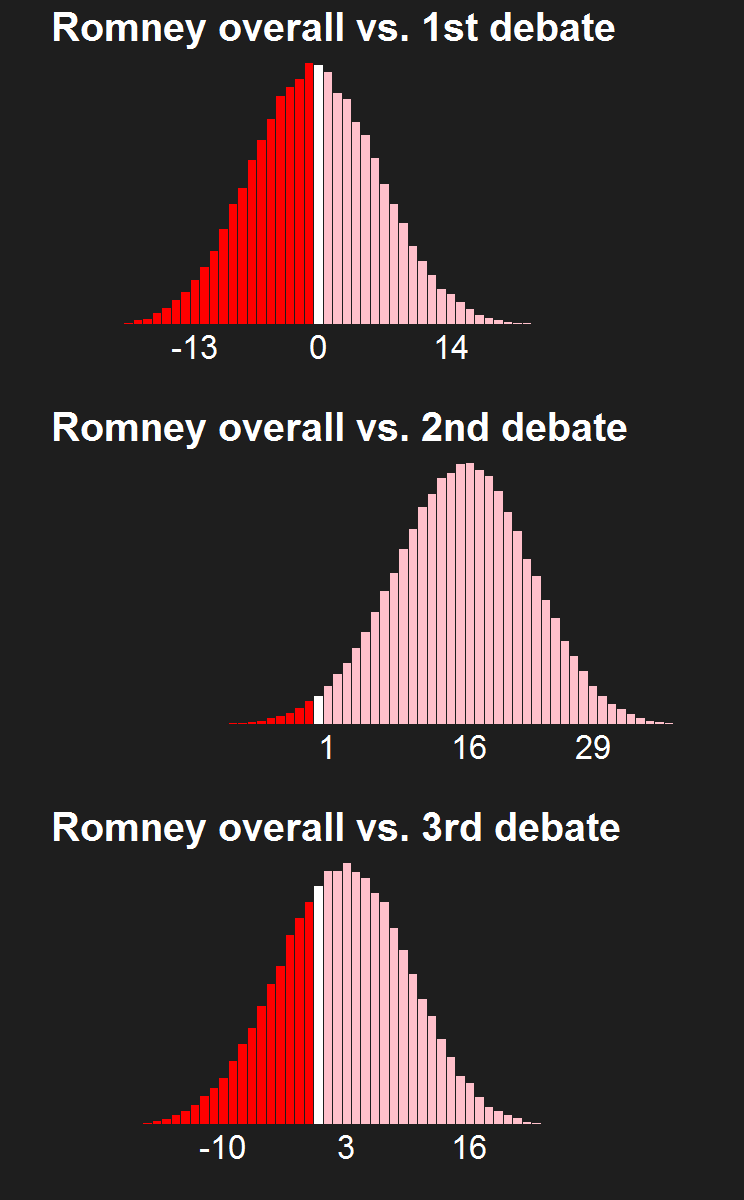
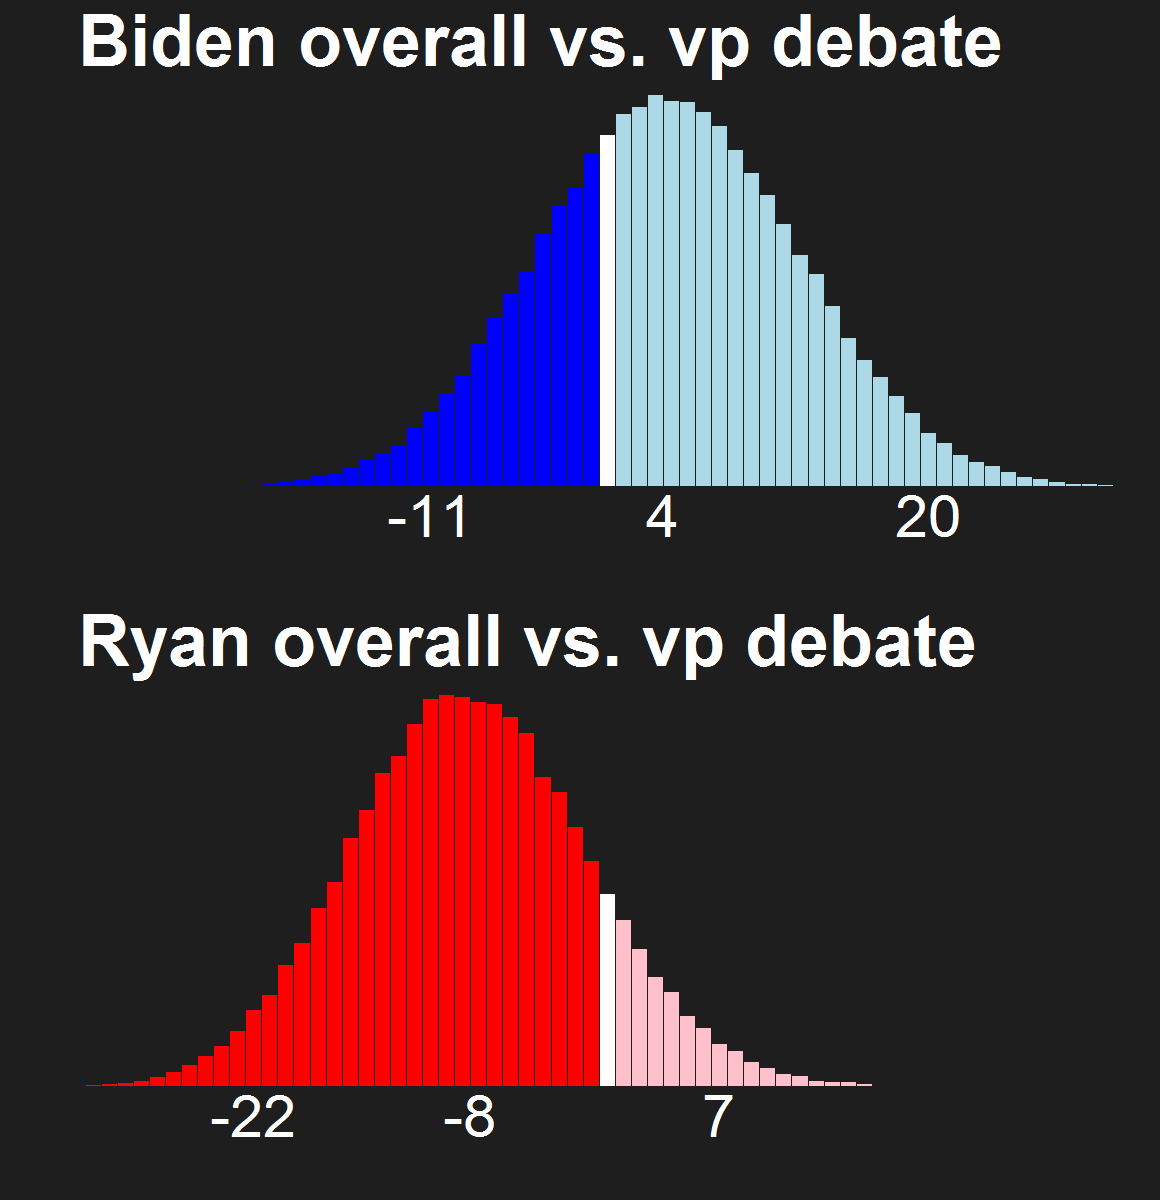
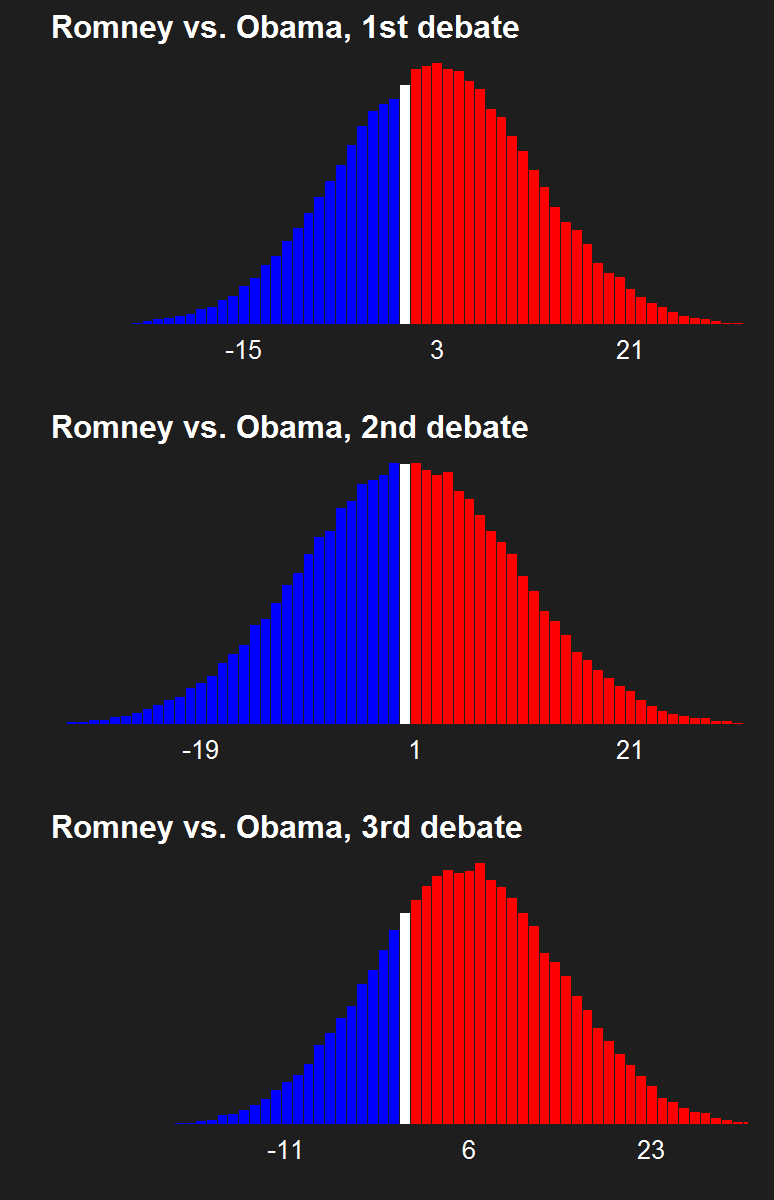
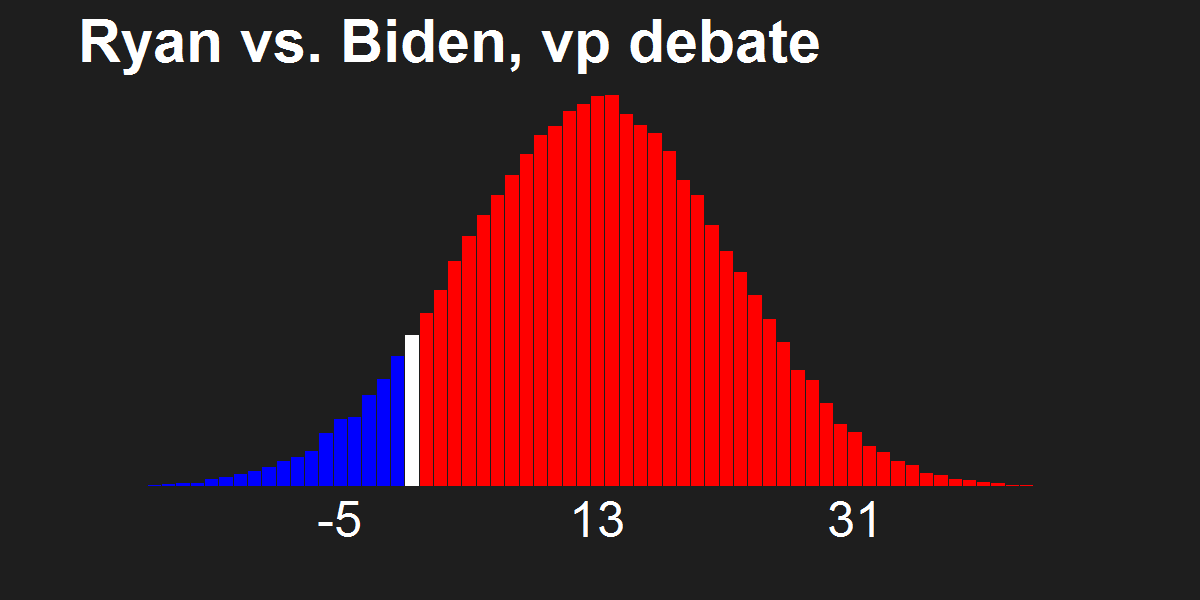
Each histogram is labeled with the candidate's name, and the mean bullpucky score in between the lower and upper bounds of the 95% confidence interval. This sort of plot is called a small multiple, which compares a bunch of distributions in separate images of a similar type. It's a different strategy from the one I use in creating malark-O-glimpse.
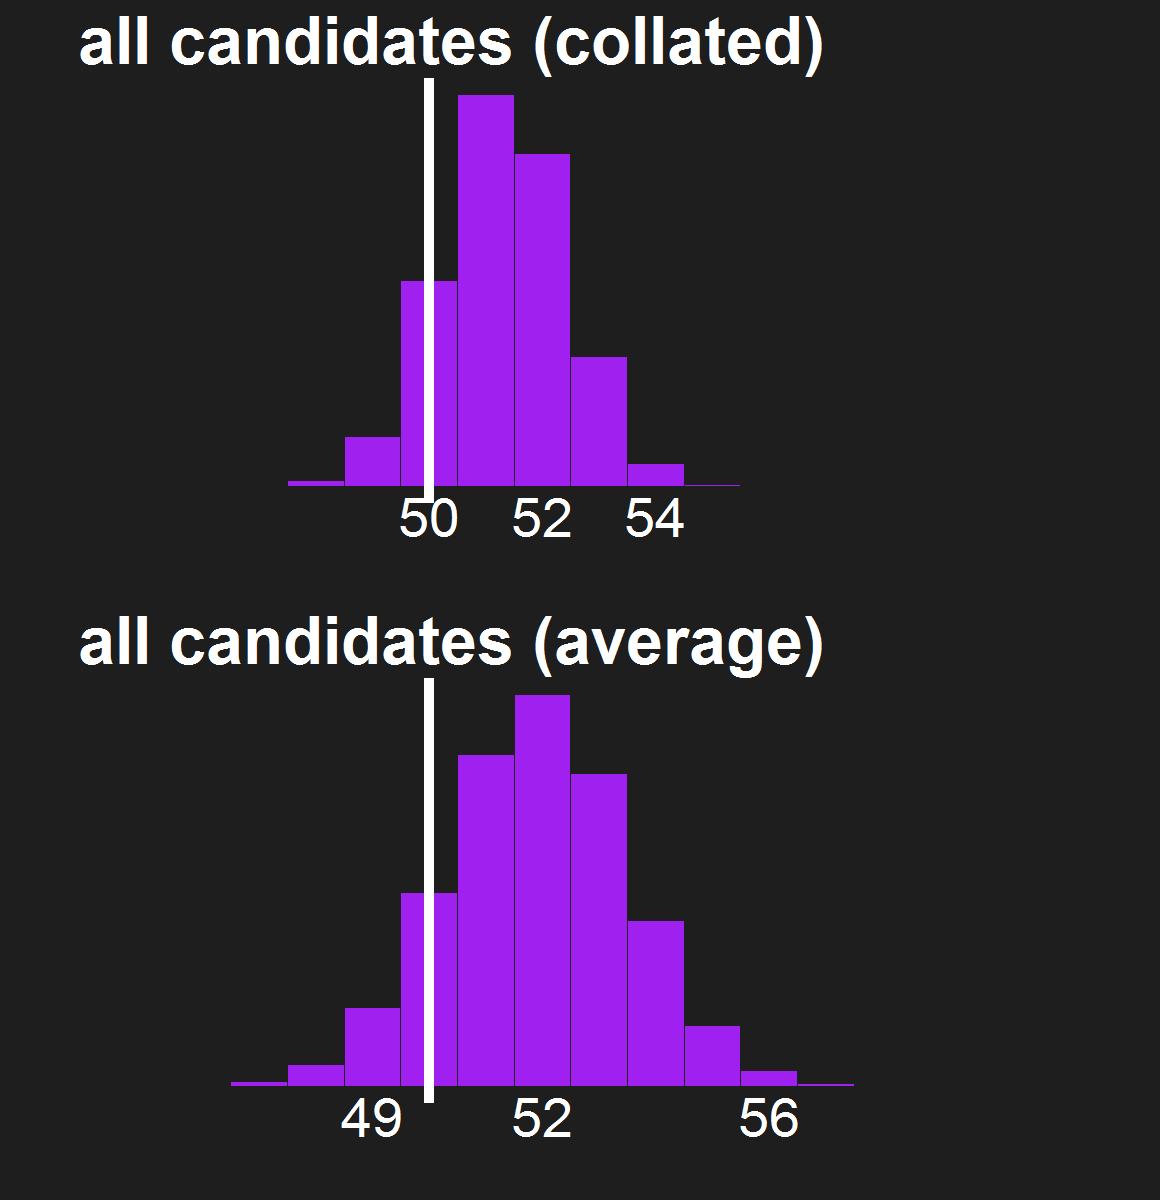
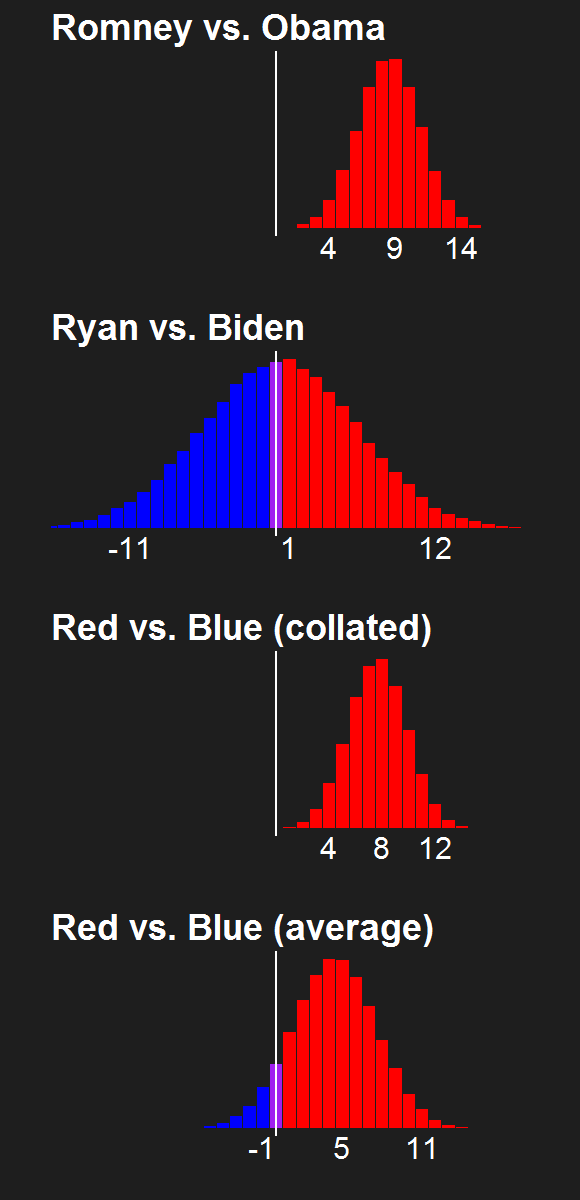
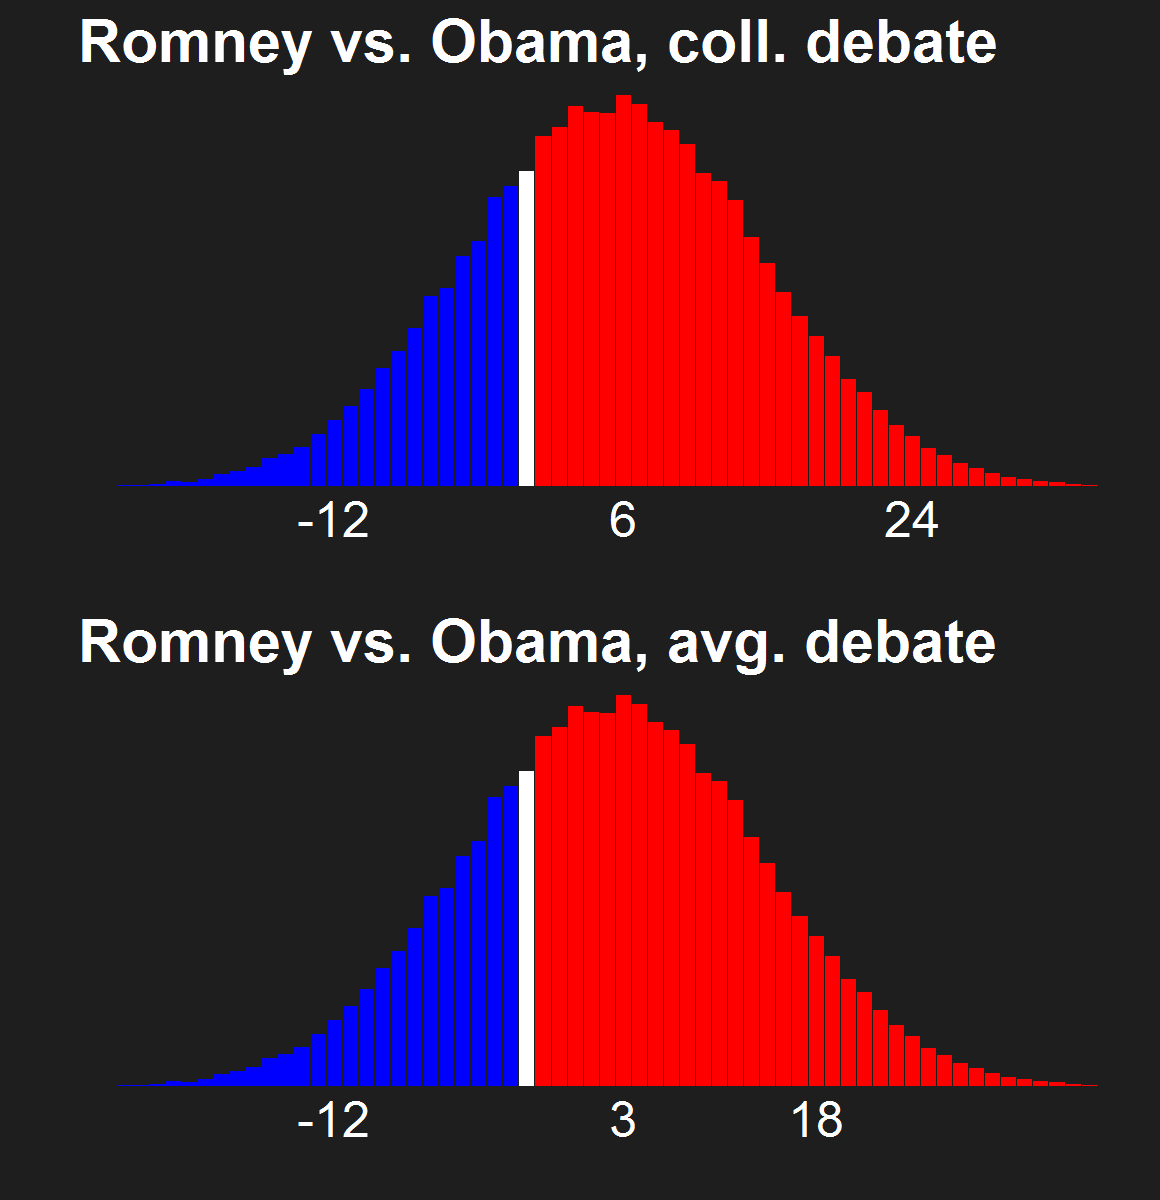
I'll do something similar to compare the distributions of collated and average bullpucky scores over the two main presidential tickets. Here's a preview of fuzzy portraits using outdated data (2012-10-16).
Notice how the confidence intervals widen a little bit from collated to average bullpucky. That's because collated bullpucky has an increased sample size over individual bullpucky, thus lower uncertainty. Yet average bullpucky is an average of random variables, which introduces more uncertainty beyond the uncertainty we already have in the bullpucky of the individuals.
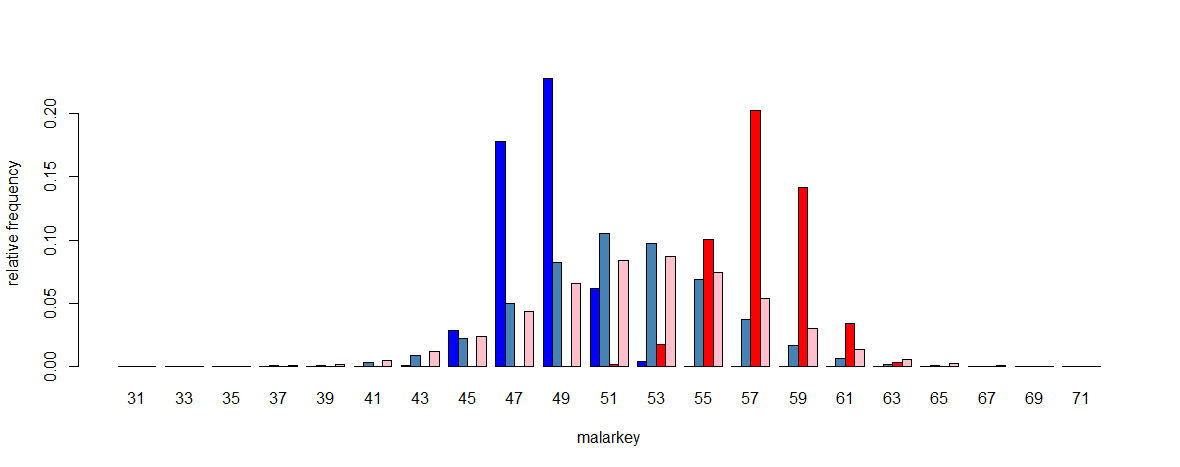
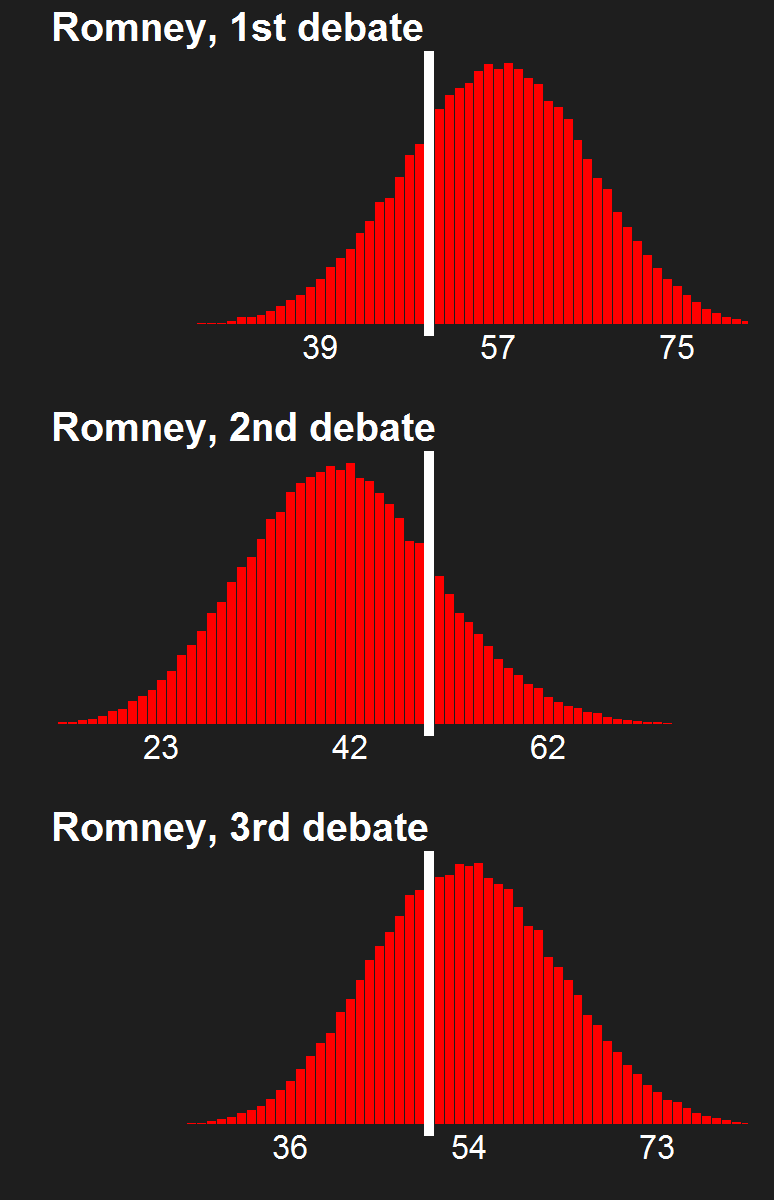
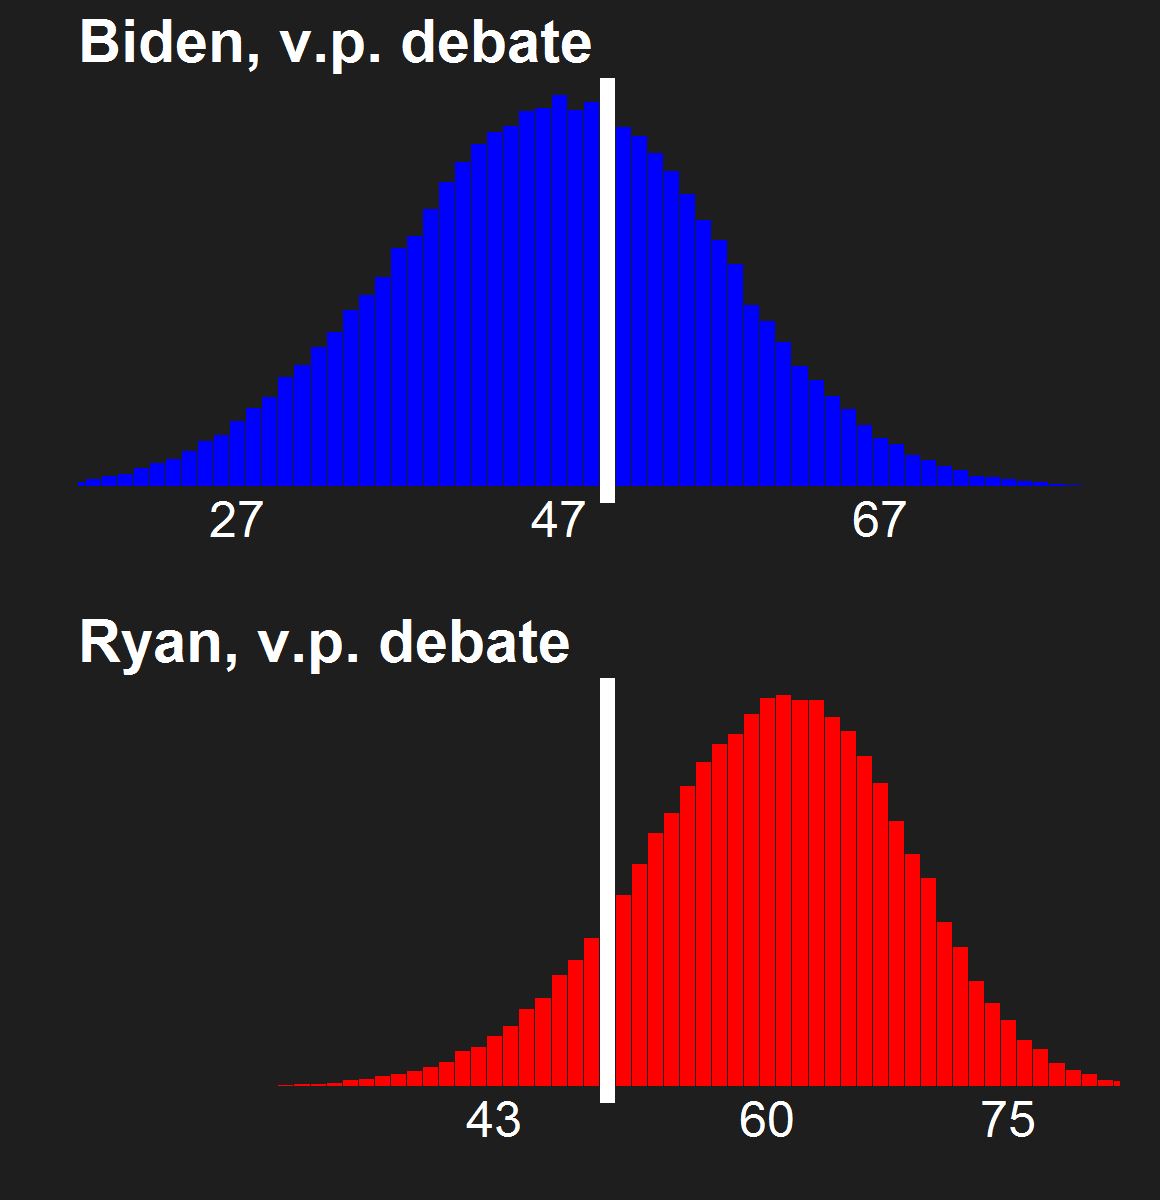
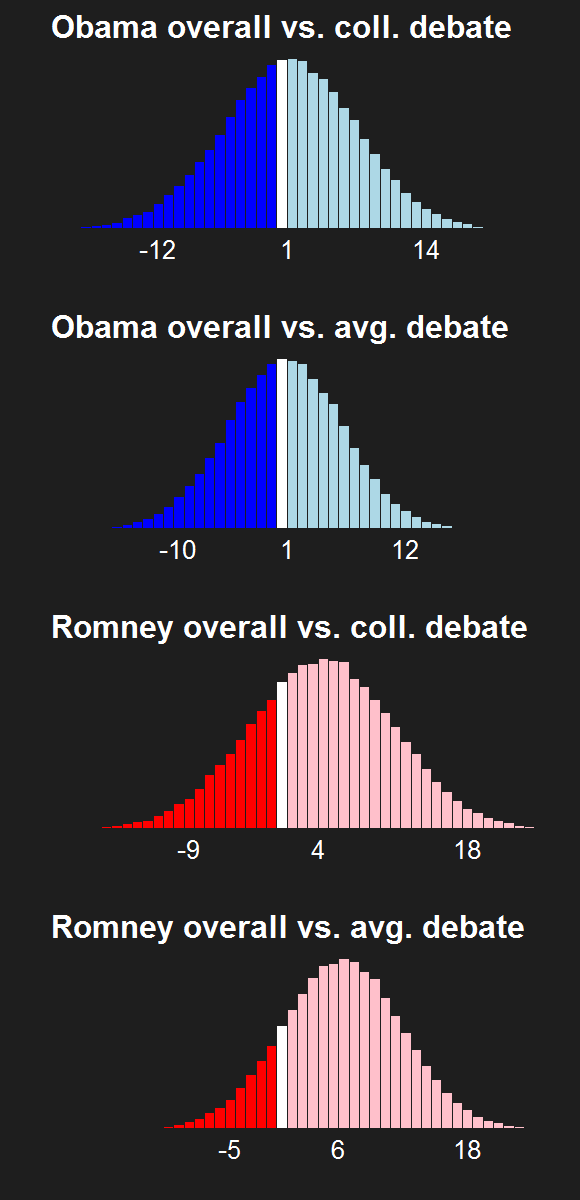
Each histogram is labeled with the candidate's name, and the mean bullpucky score in between the lower and upper bounds of the 95% confidence interval. This sort of plot is called a small multiple, which compares a bunch of distributions in separate images of a similar type. It's a different strategy from the one I use in creating malark-O-glimpse.
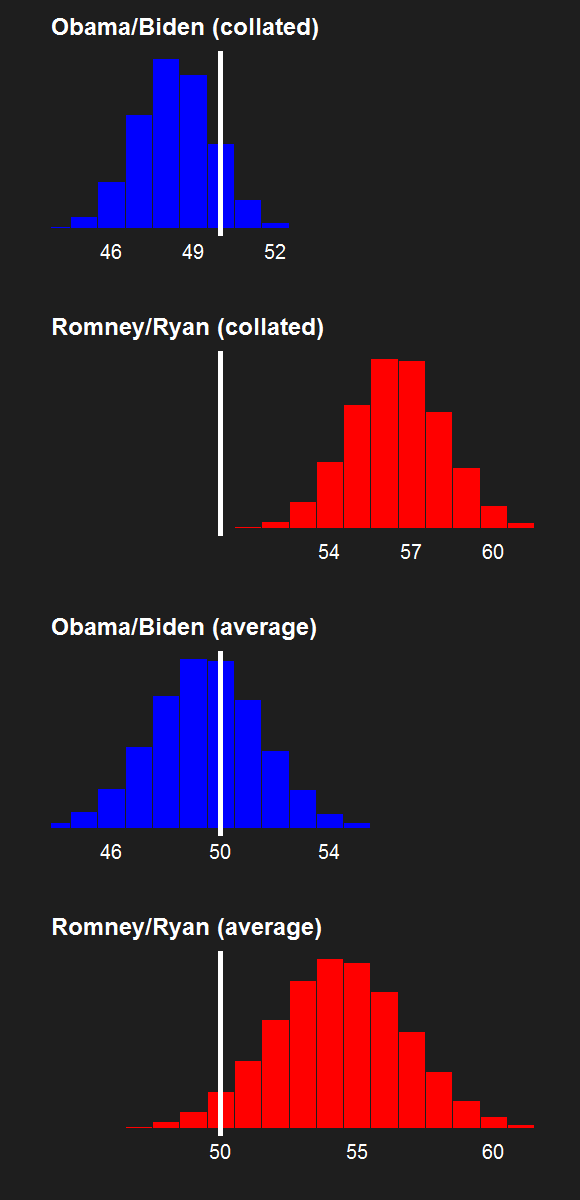
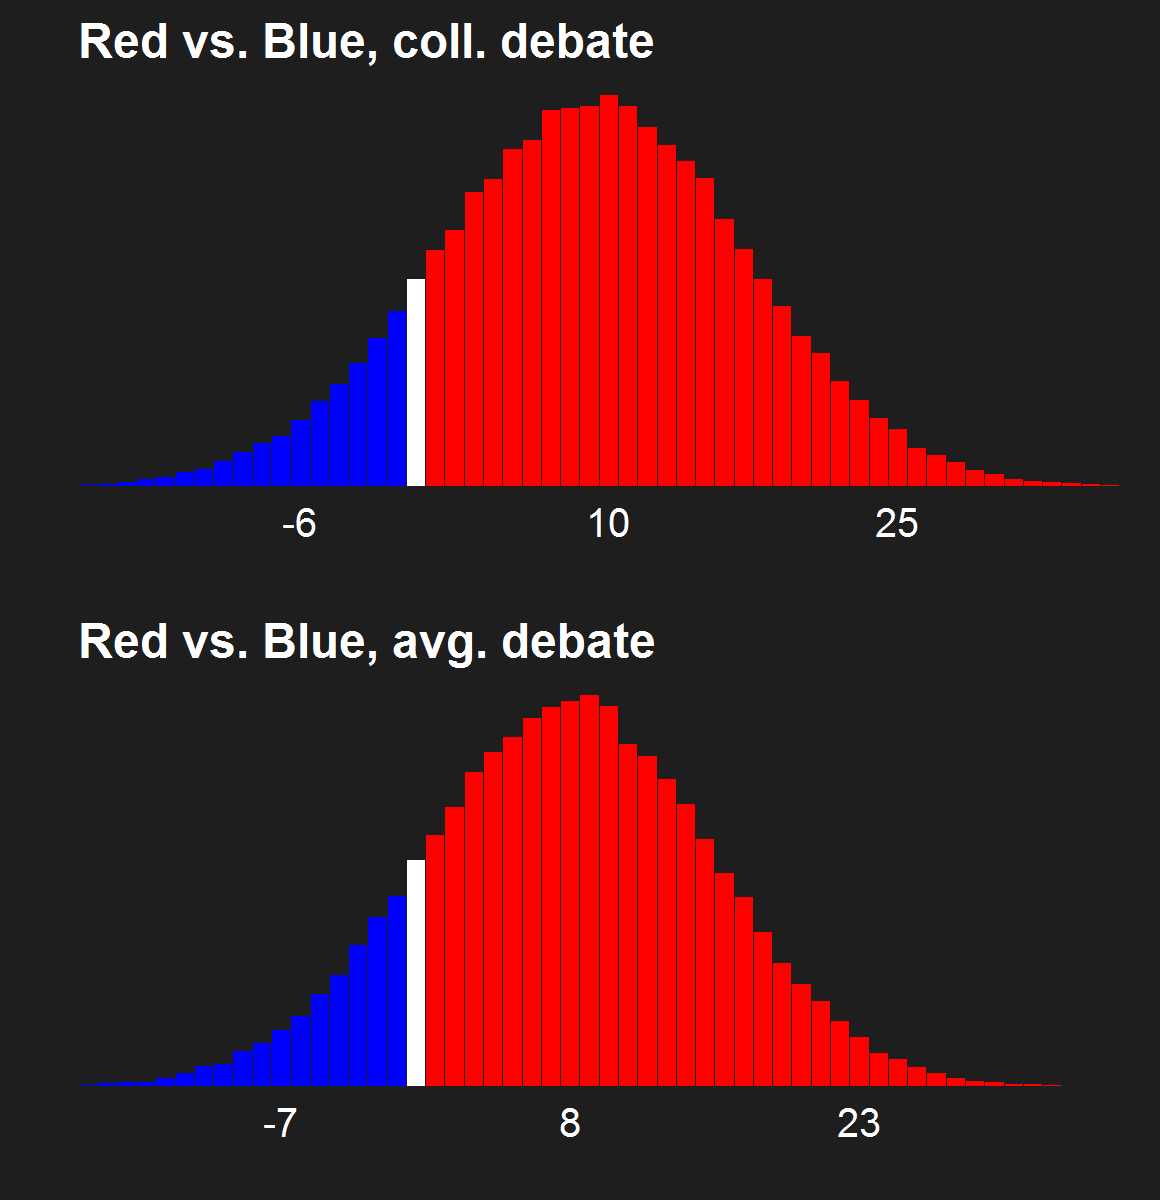
I'll do something similar to compare the distributions of collated and average bullpucky scores over the two main presidential tickets. Here's a preview of fuzzy portraits using outdated data (2012-10-16).
Notice how the confidence intervals widen a little bit from collated to average bullpucky. That's because collated bullpucky has an increased sample size over individual bullpucky, thus lower uncertainty. Yet average bullpucky is an average of random variables, which introduces more uncertainty beyond the uncertainty we already have in the bullpucky of the individuals.